aiai LAB 002 — THE CITY HAS A PULSE · Recorded in the browser
WEBSITE · DATA ART
aiai nishinomiya
A city's data, put on the web as art.
まちのデータを、作品としてウェブに置く。
- ROLE
- Creative Direction / Art Direction (Web / aiai rebranding) / Web Design & Development / Data Art & Visualization (aiai LAB)
- キャラクターとイラストの原画は、支給されたアートワークです。
- CLIENT
- Jenowers Plus — Nishinomiya, Japan
- YEAR
- 2026 — ongoing
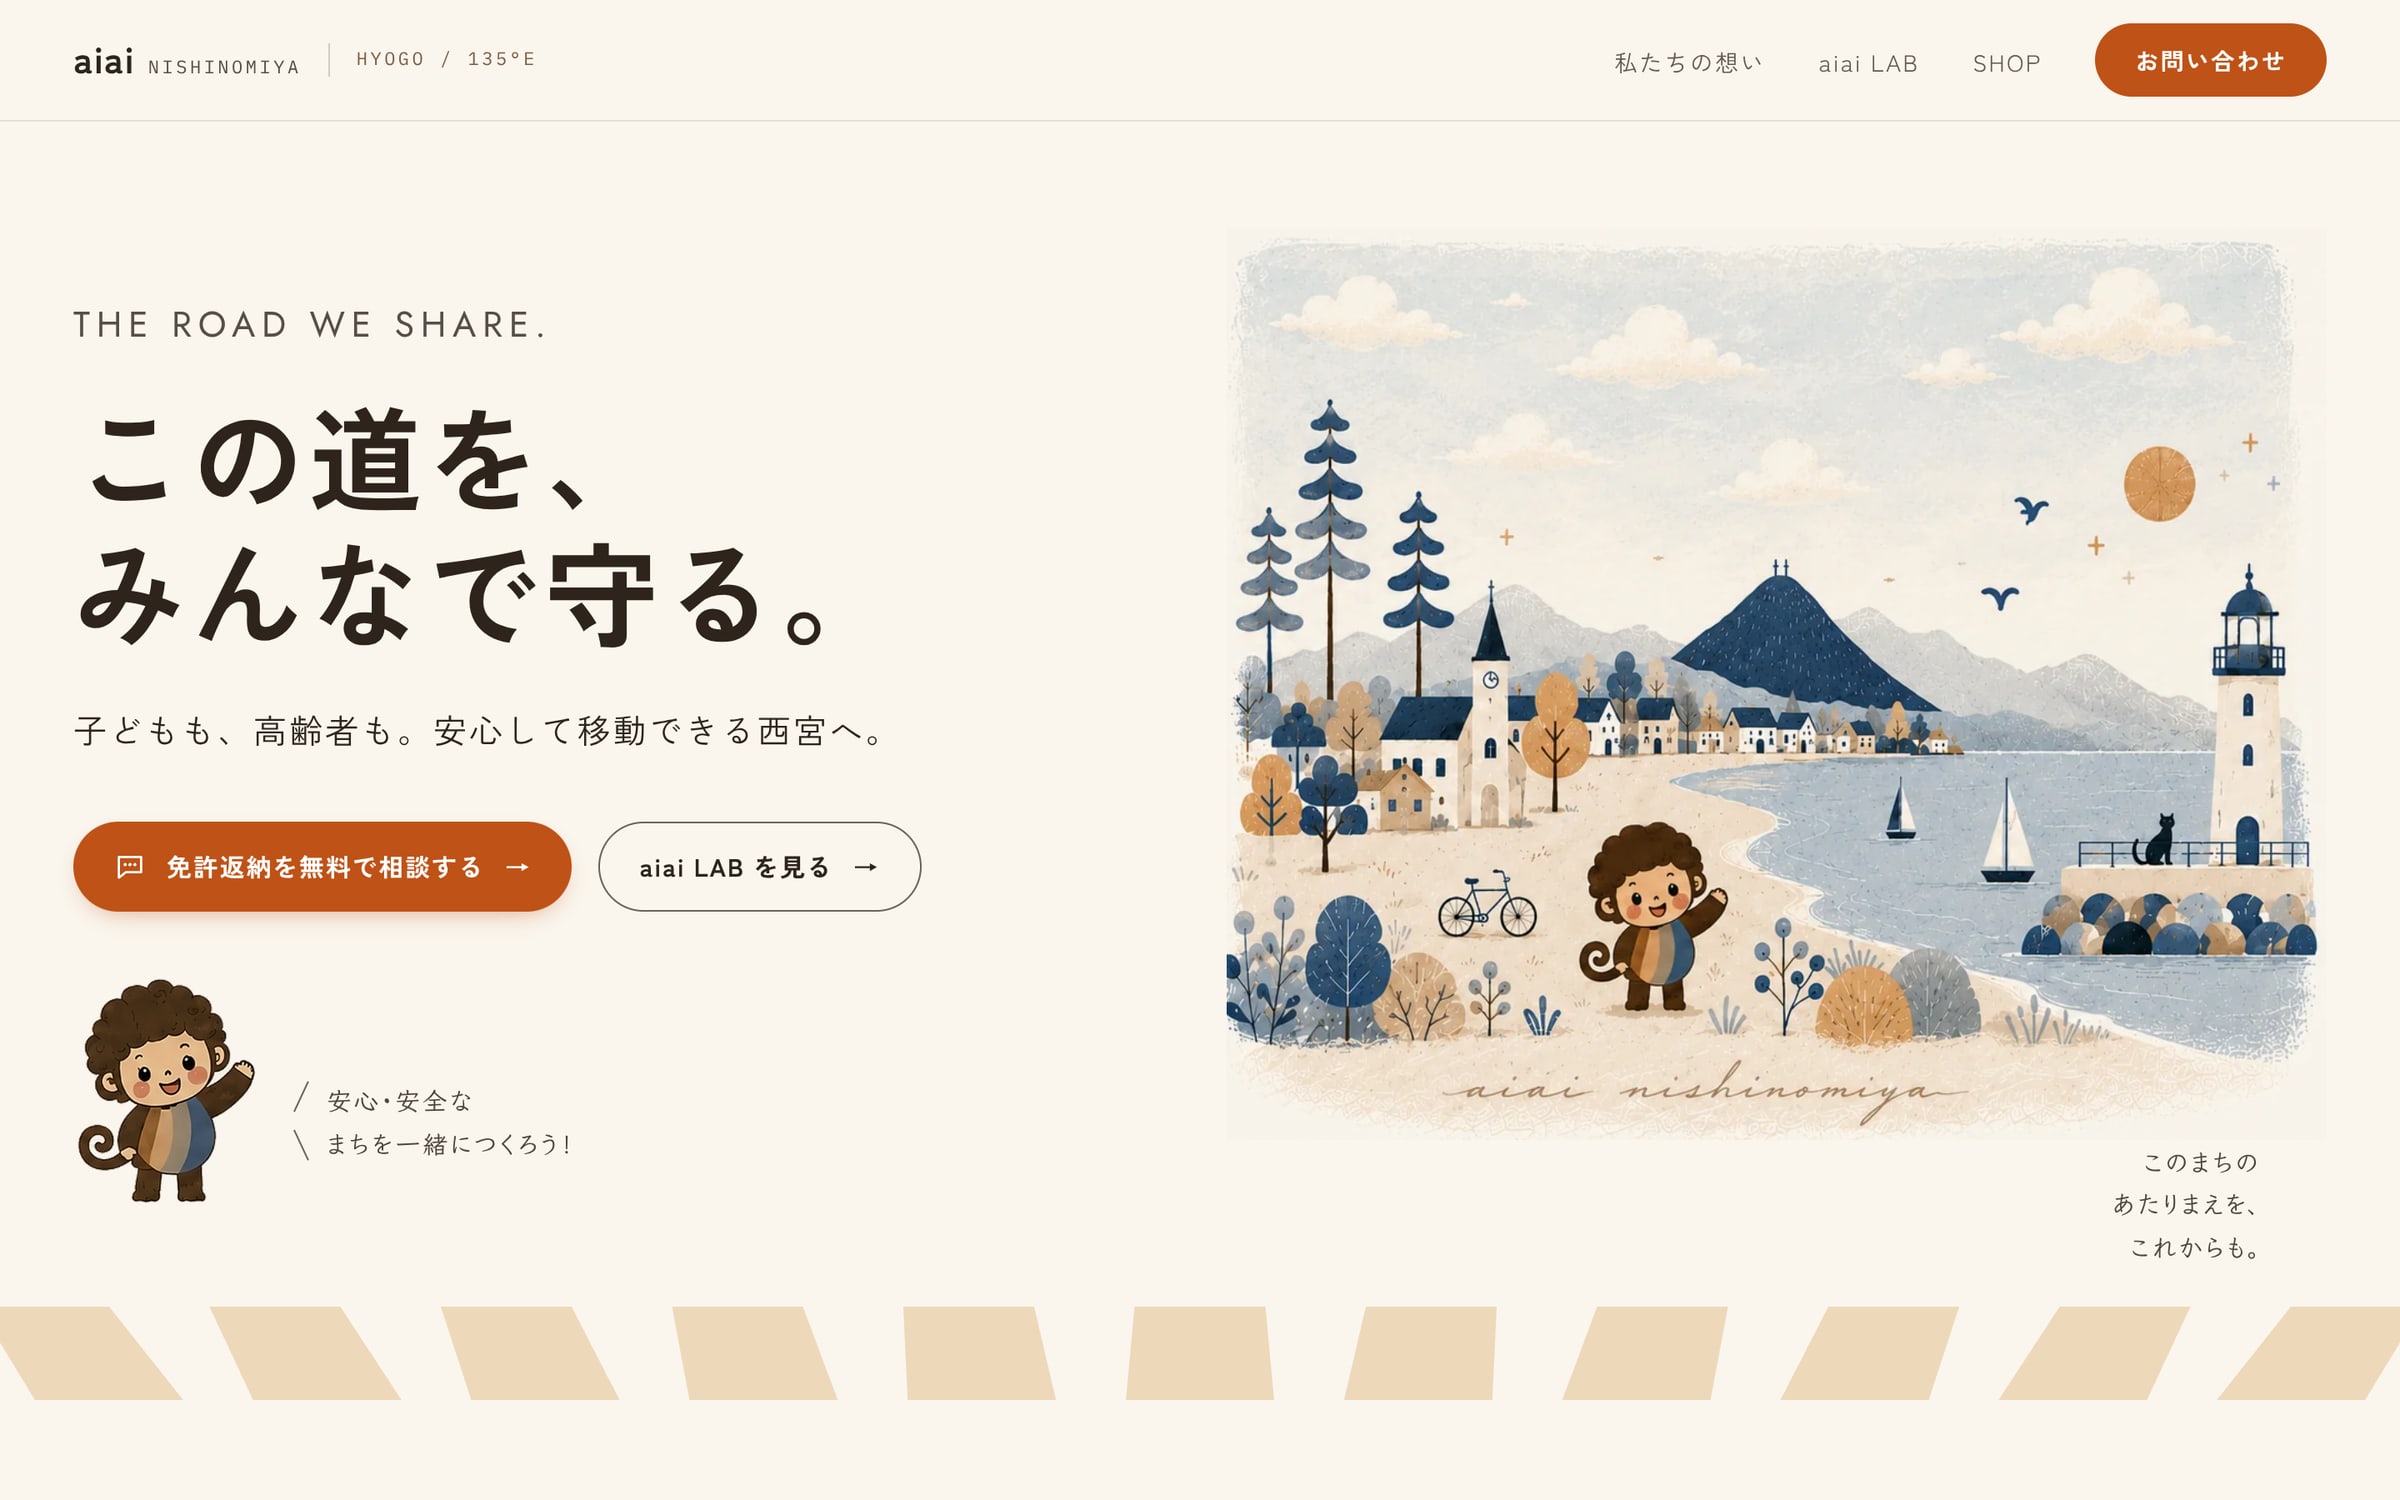
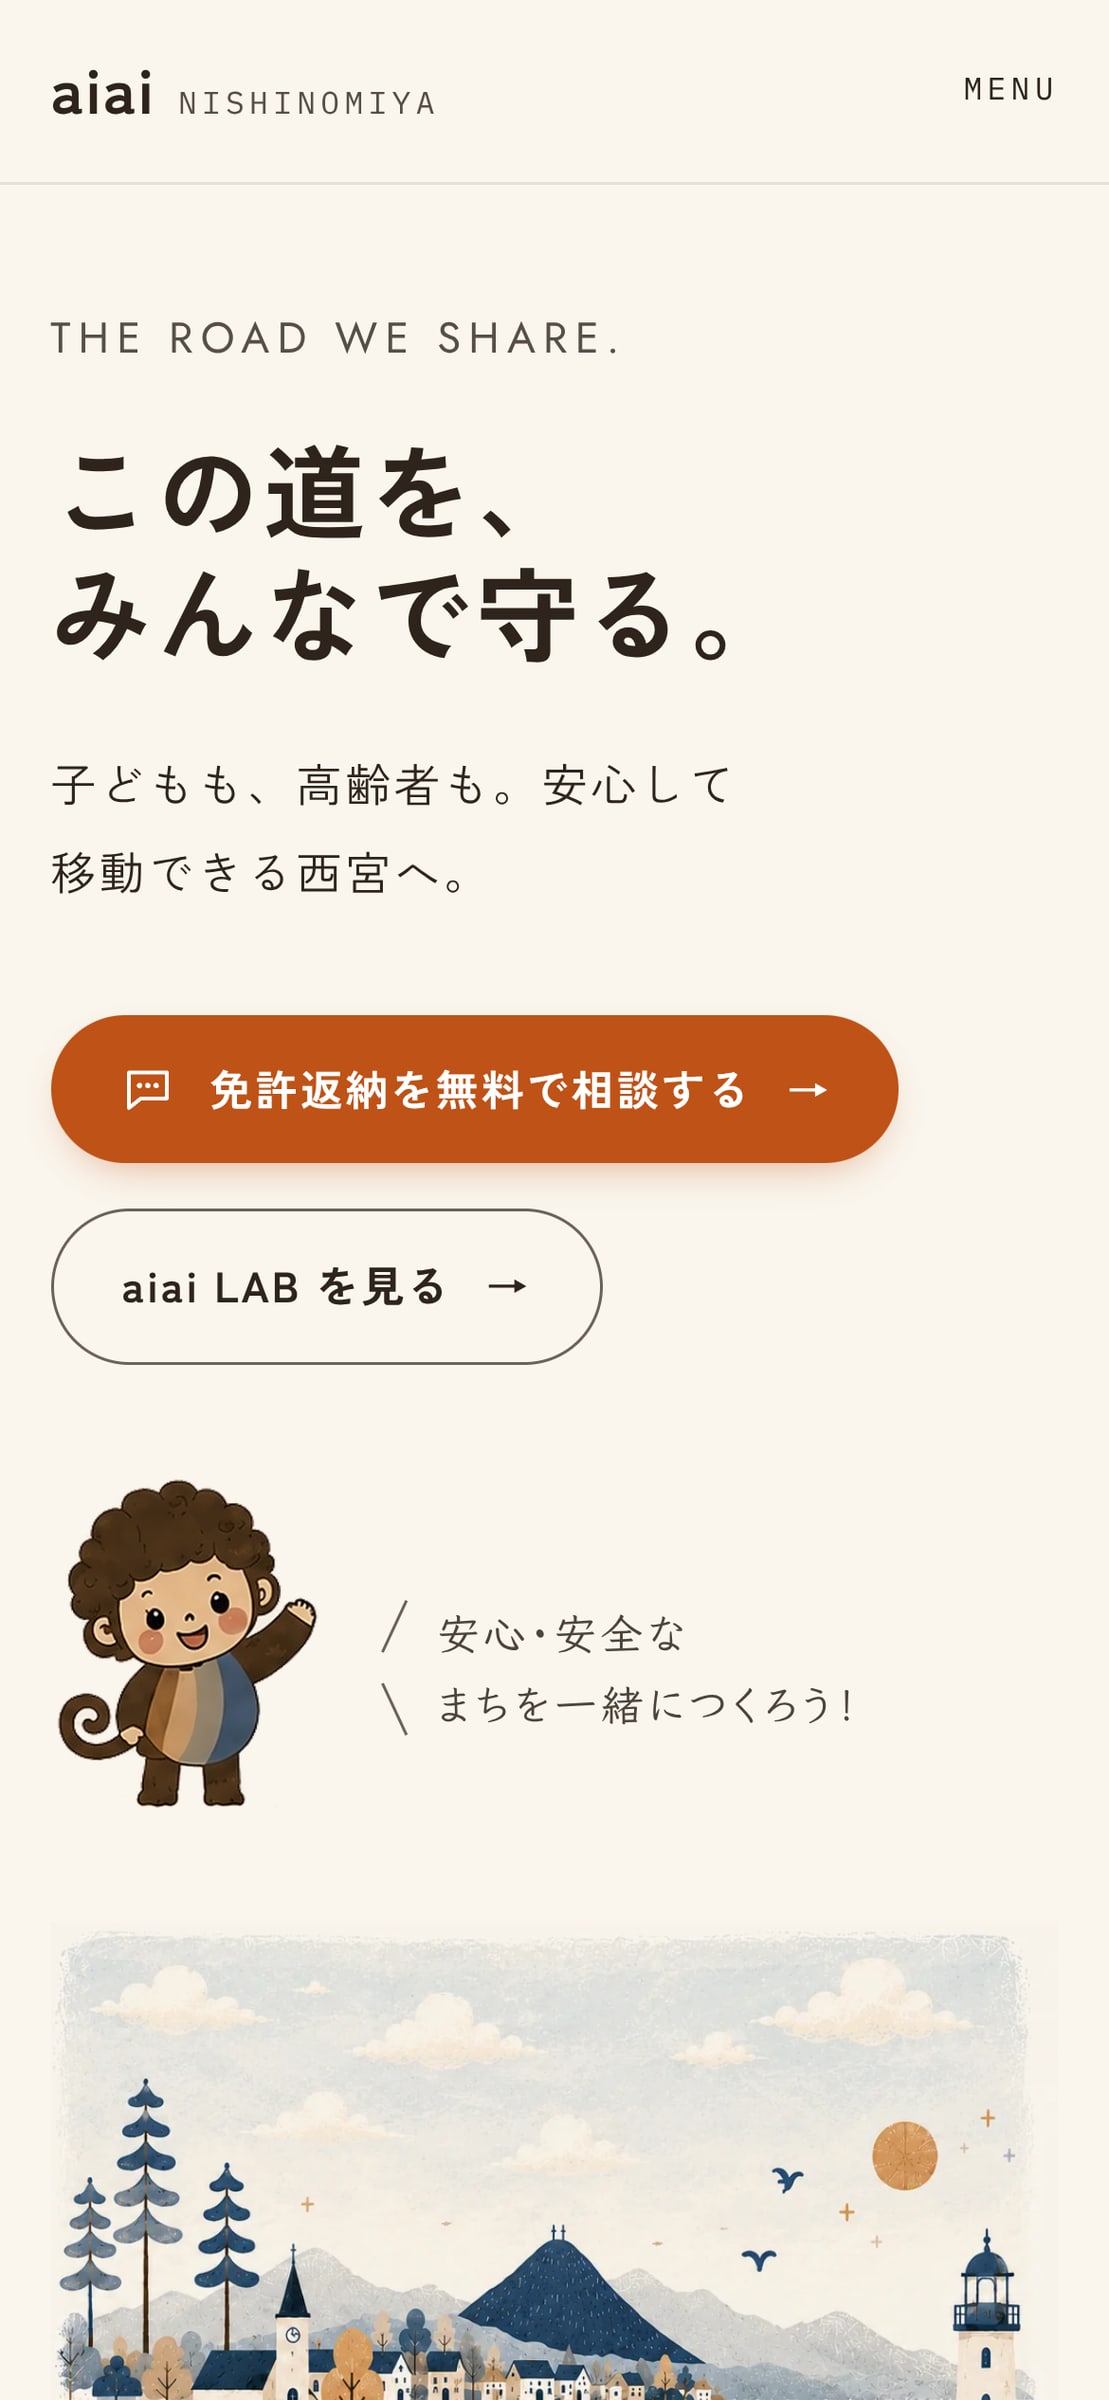
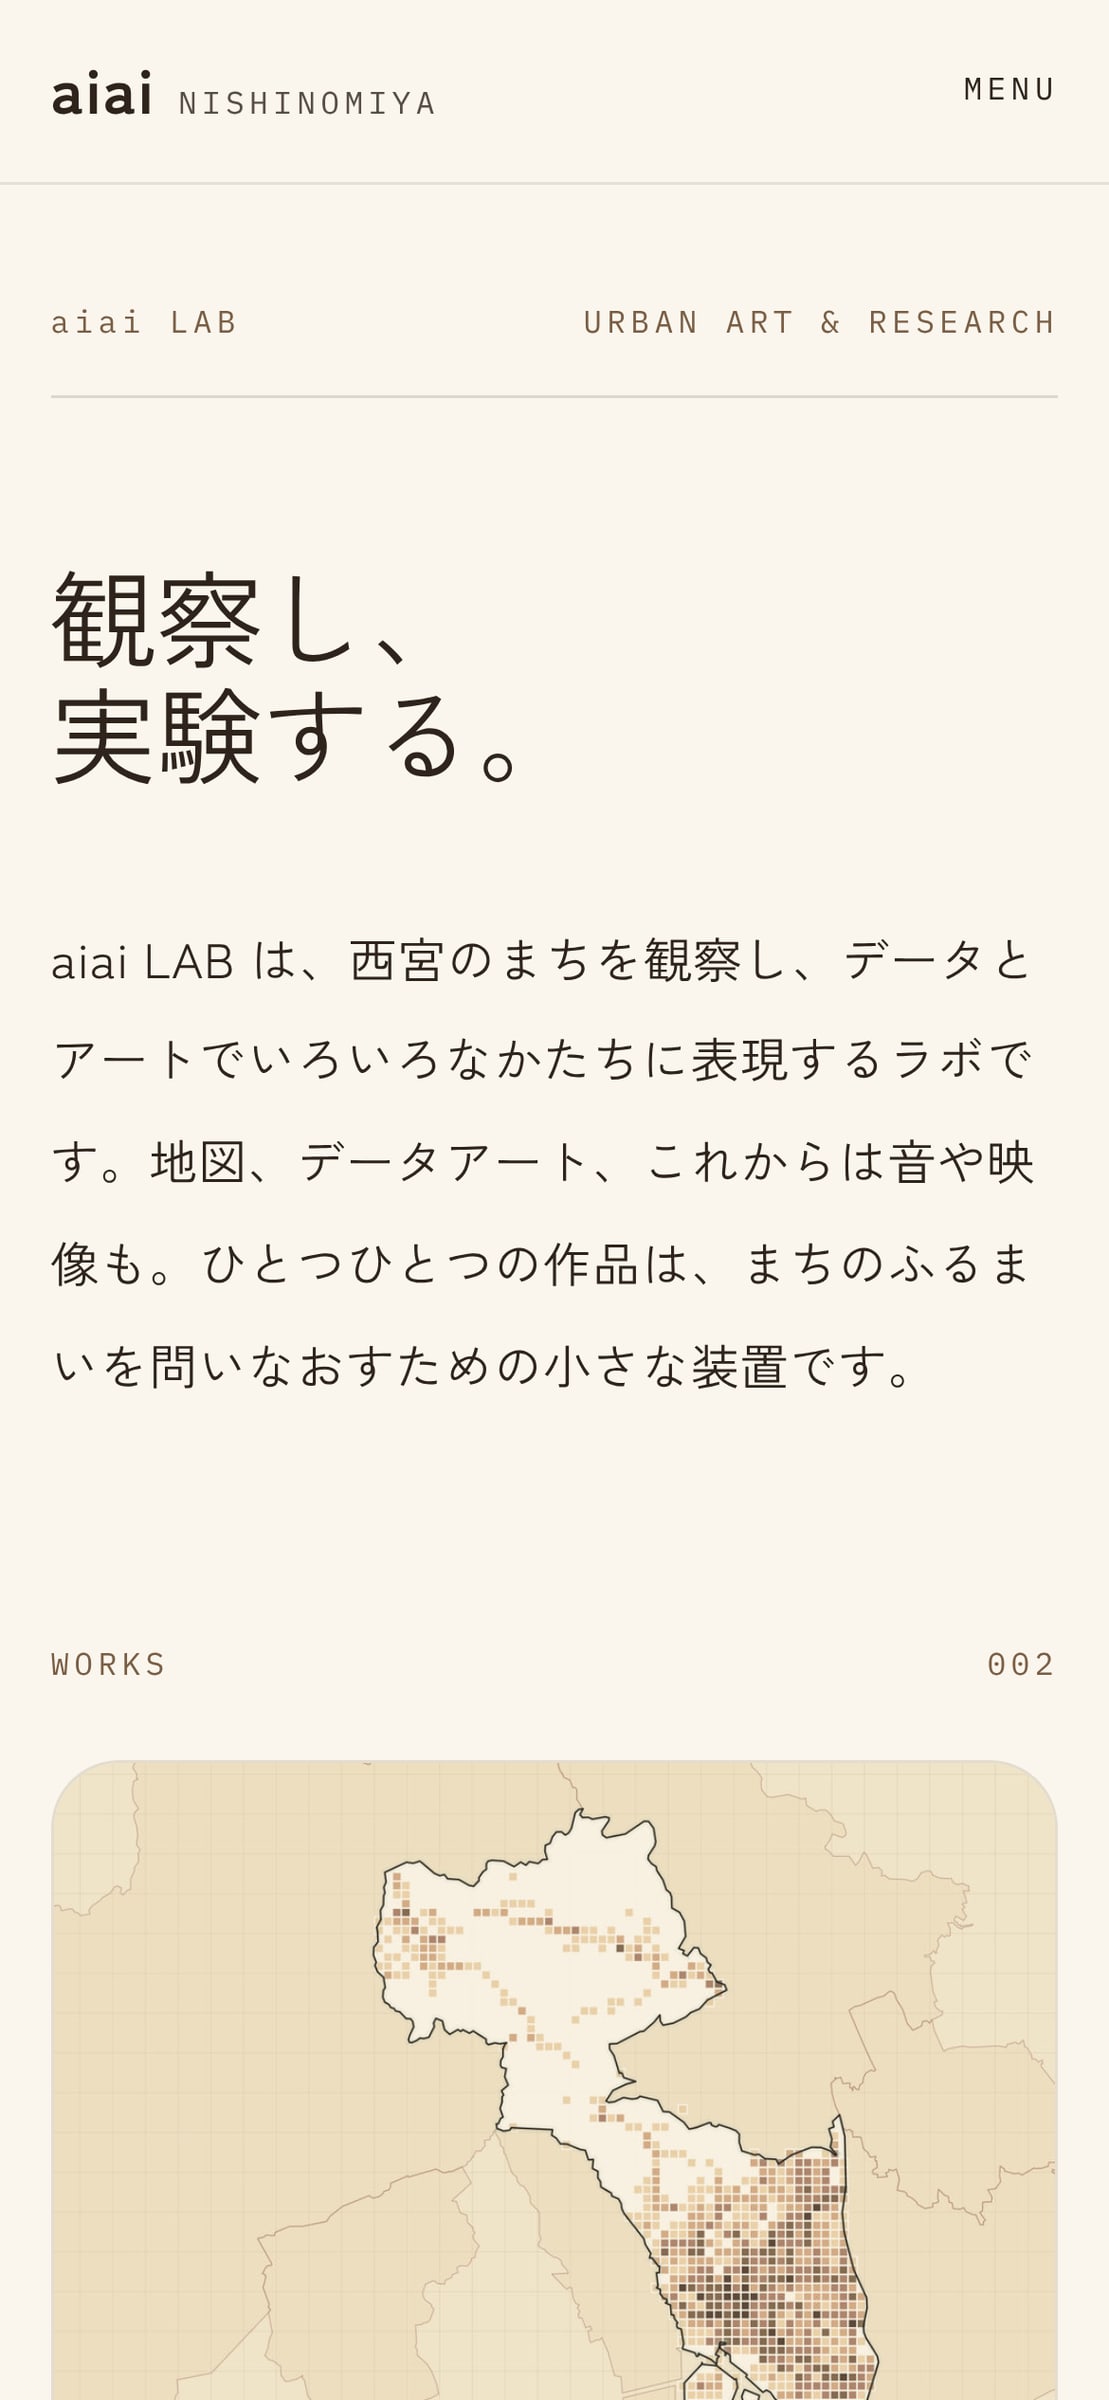
西宮の Jenowers Plus が運営する aiai nishinomiya のウェブサイトを制作しました。 掲げるのは「デザインとアートで、ふるまいの美しいまちへ。」 サイトには、まちを観察し、公開データとアートで表現する aiai LAB を置き、 ページを読むための場所ではなく、作品を体験する場所として組み立てています。
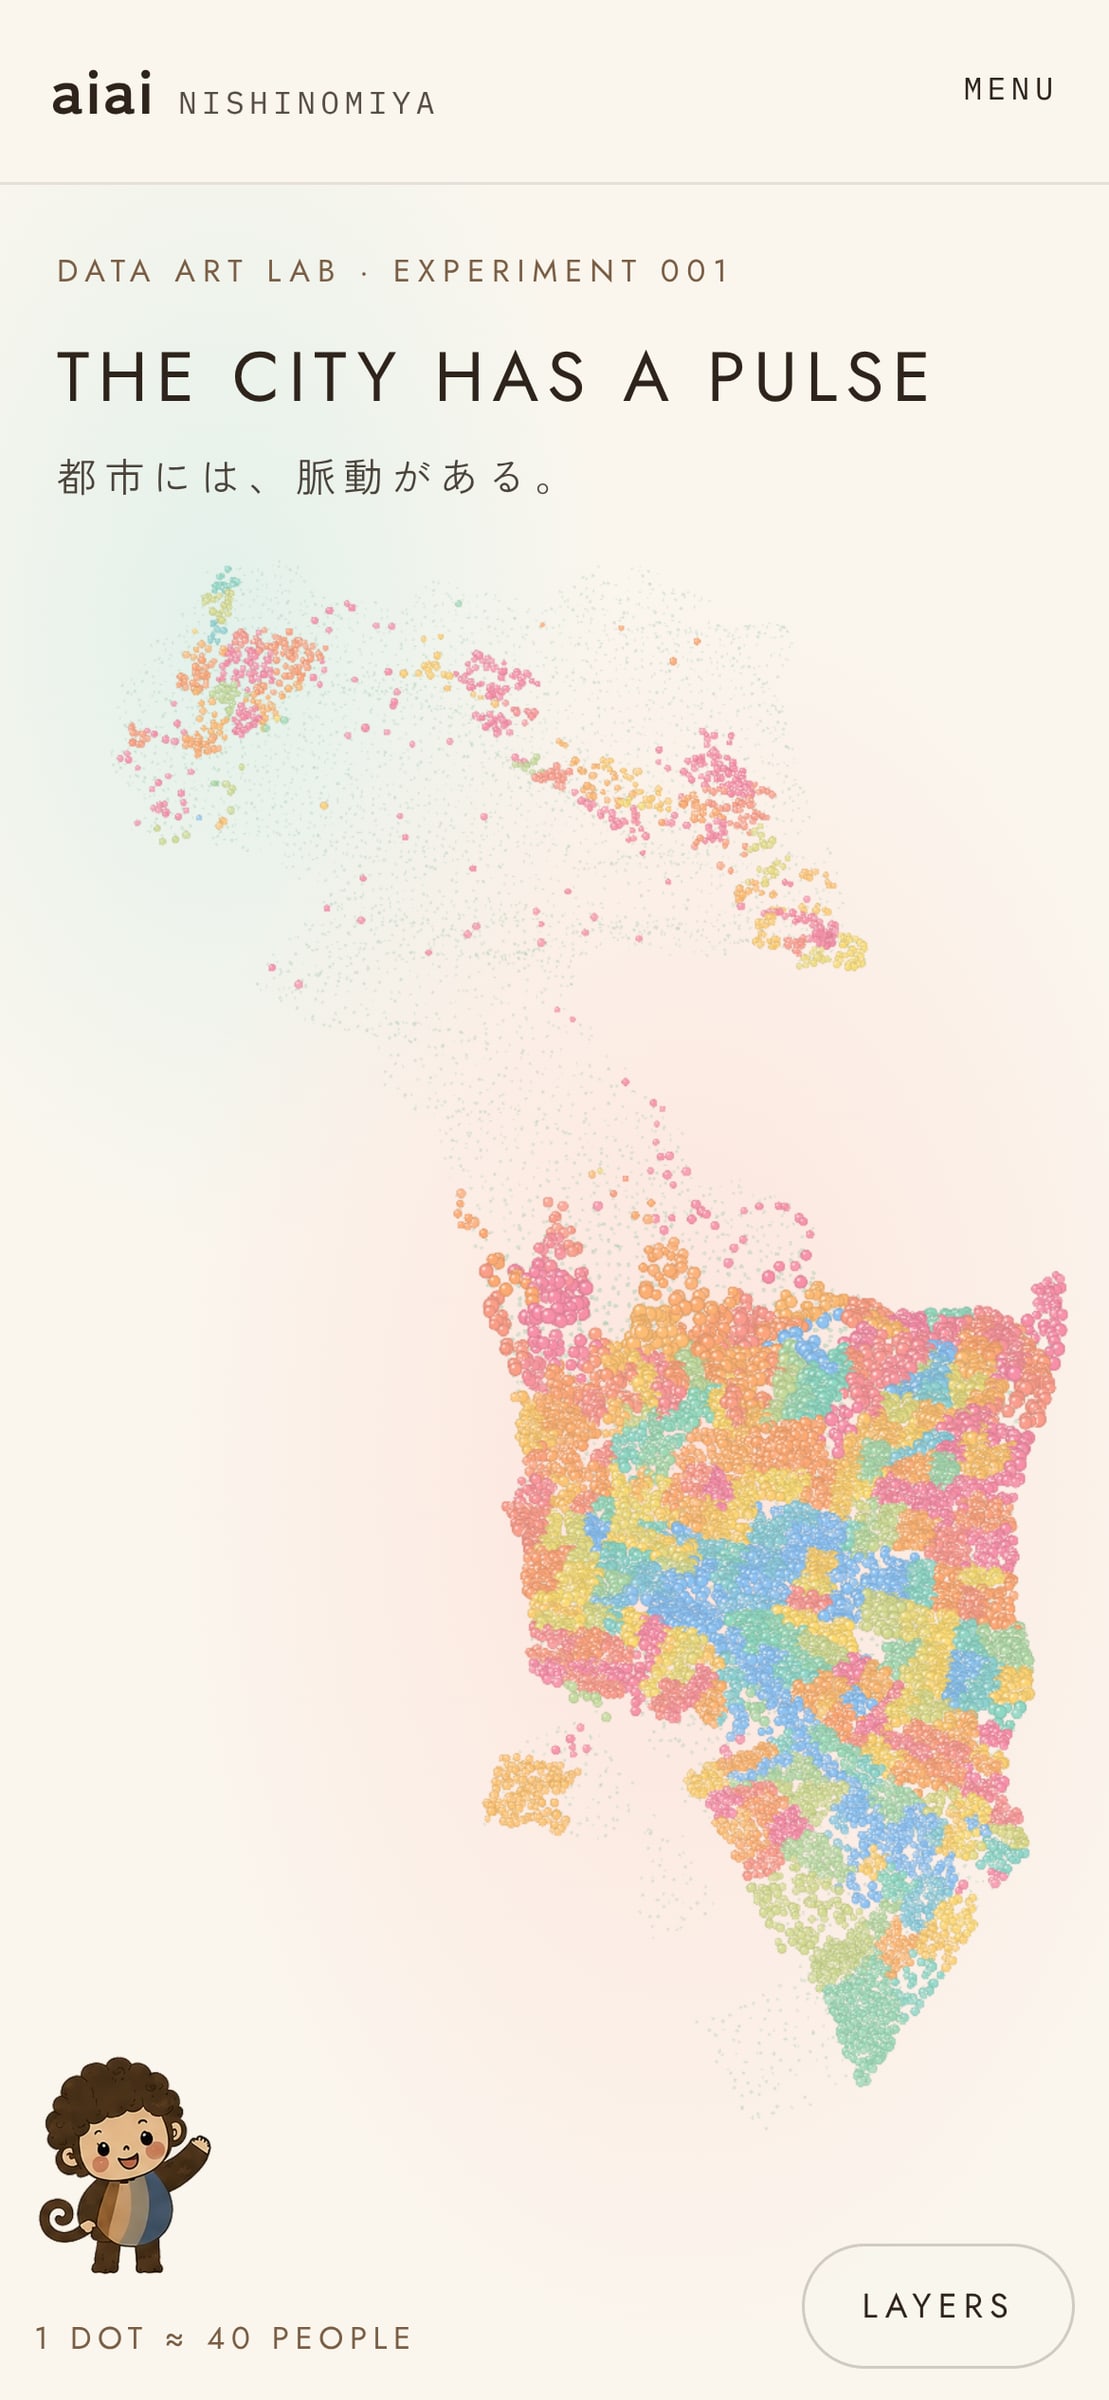
その2作目「THE CITY HAS A PULSE」は、西宮に暮らす48万5,587人を色の粒に置き換え、 海から山へ伝わる鼓動として、ブラウザの中で動かすデータアートです。
A website for aiai nishinomiya, run by Jenowers Plus in Nishinomiya — “towards a city that behaves beautifully, through design and art.” At its core is aiai LAB, where the city is observed and expressed through public data and art: pages built to be experienced, not just read.
Its second work, THE CITY HAS A PULSE, turns the 485,587 people of Nishinomiya into particles of colour and sets them pulsing from the sea to the mountains, live in the browser.
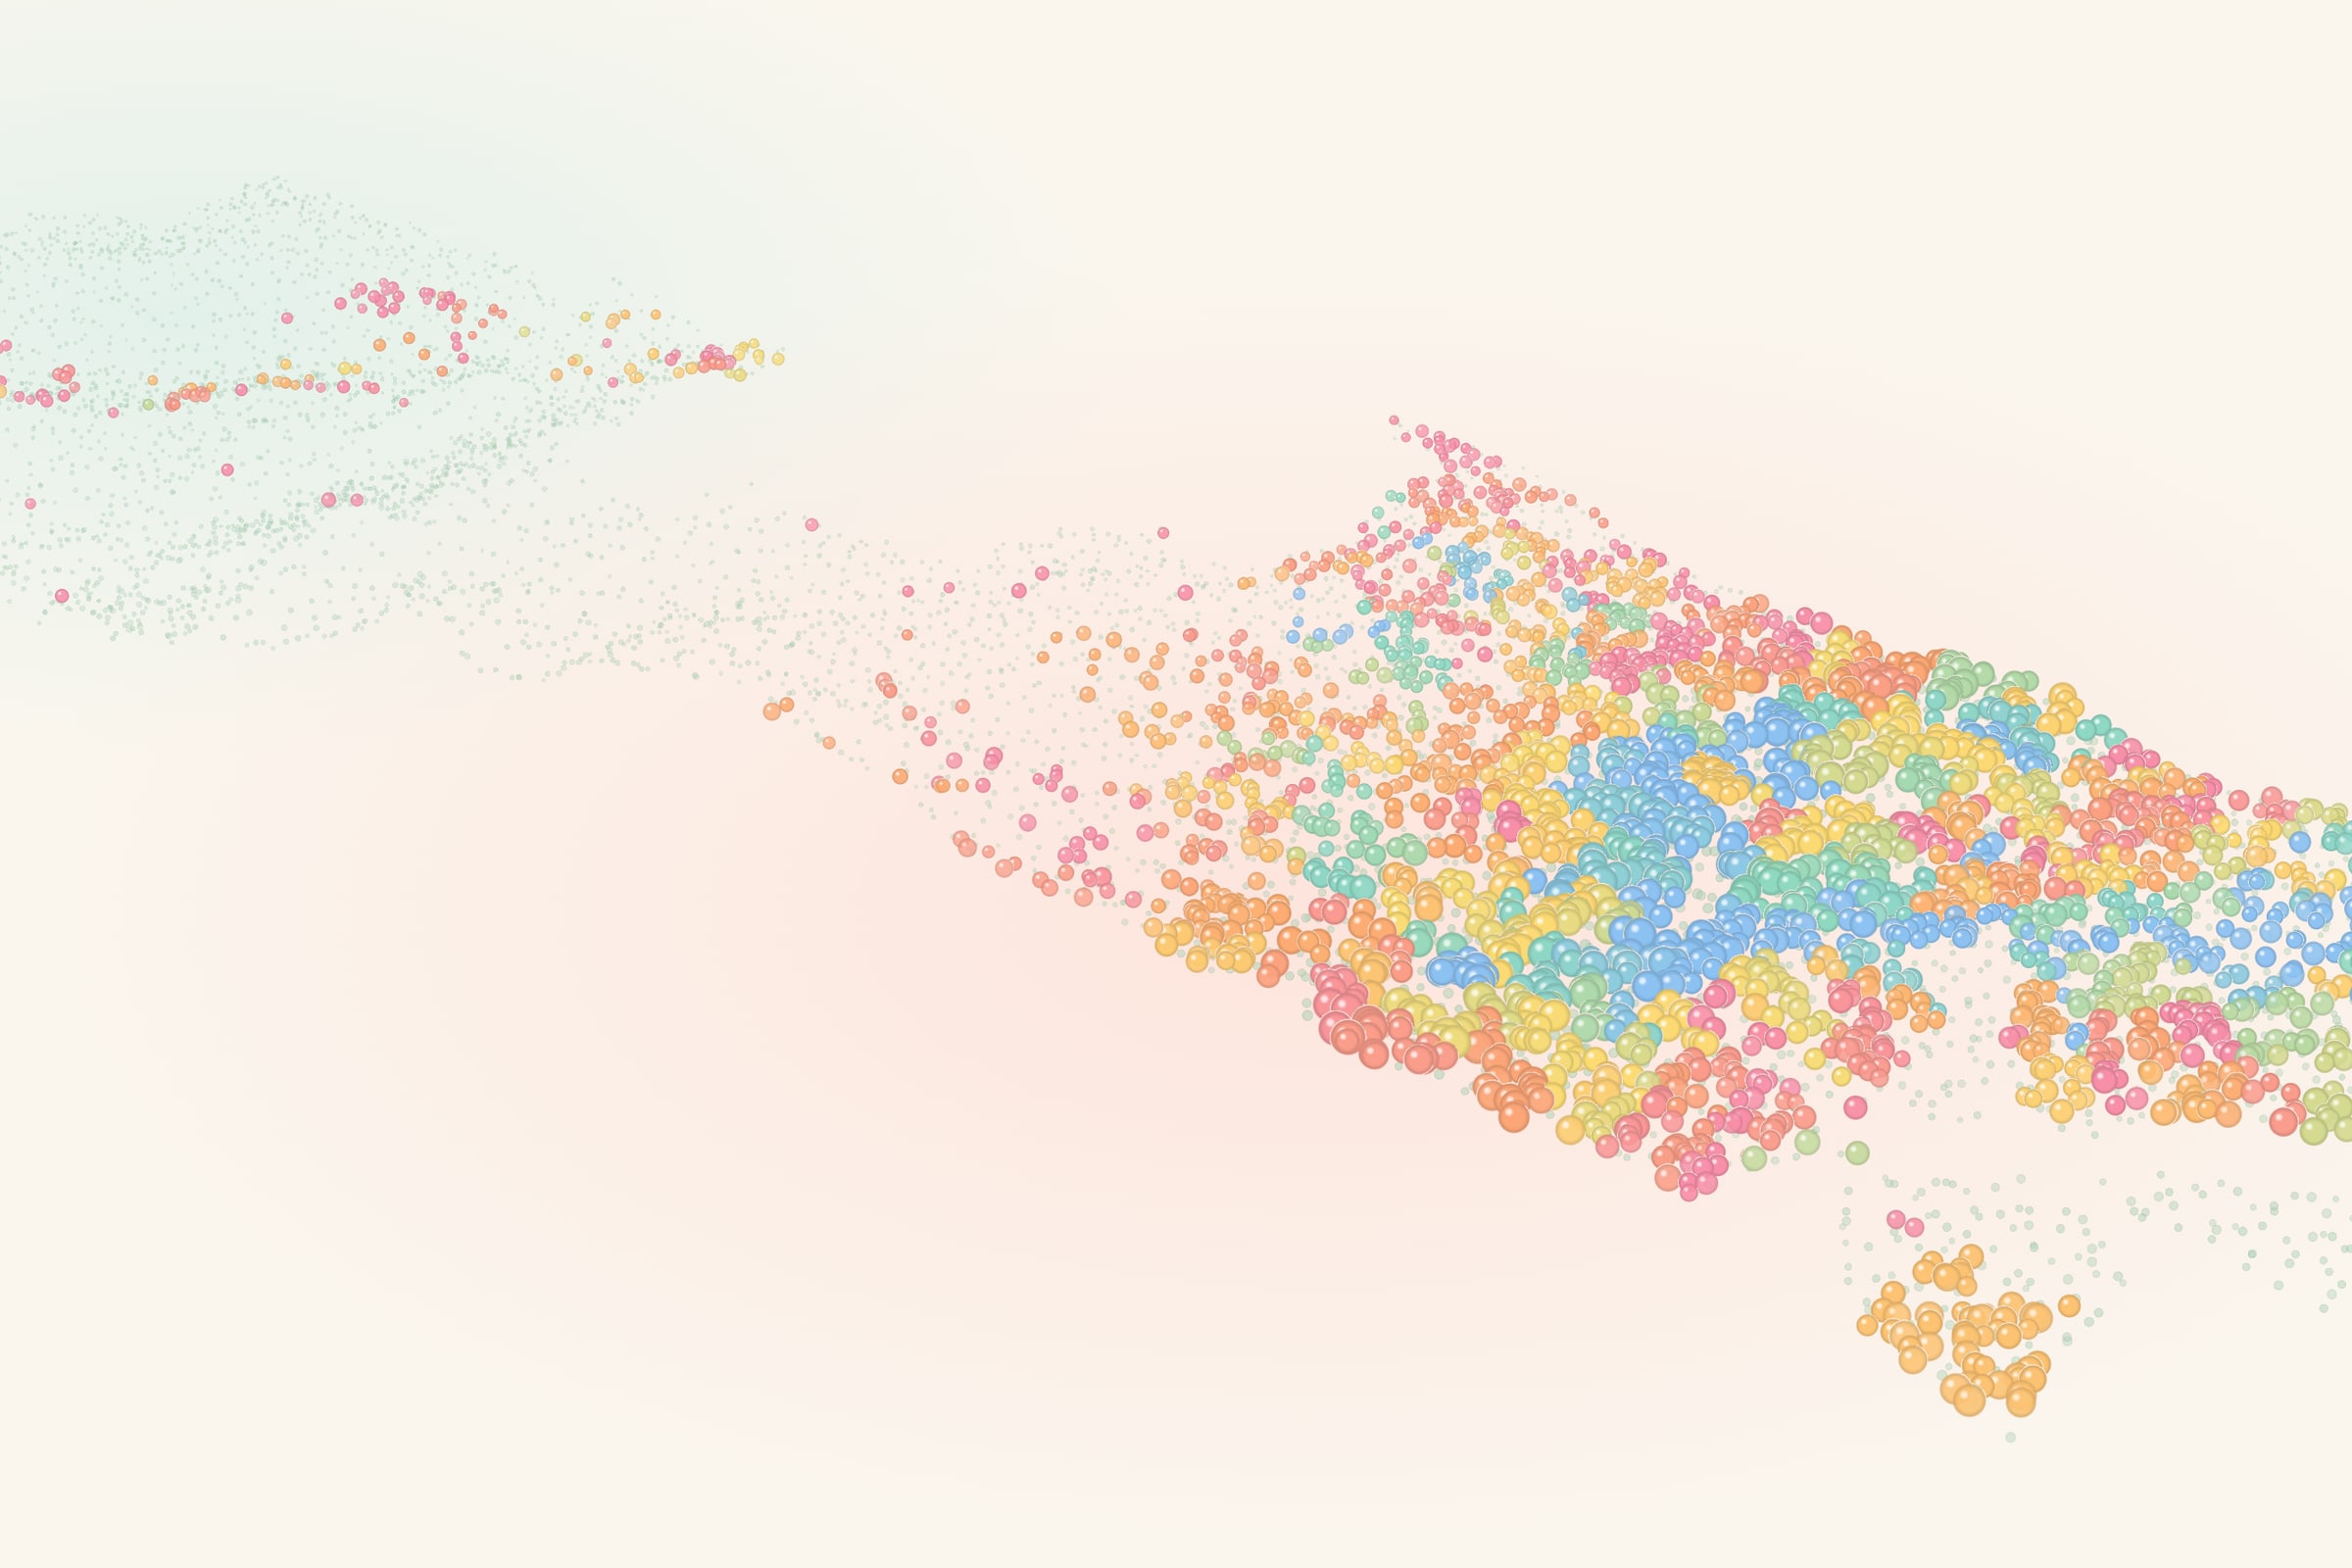
aiai LAB 002
THE CITY HAS A PULSE
都市には、脈動がある。
人口、地形、気象の実データから描く、ジェネラティブ・アート。 WEATHER に切り替えると、月ごとの気温と雨で、まちの色が一年をめぐります。 ドラッグで回し、粒に触れると、その地区の数字が現れます。
Generative art drawn from real population, terrain and weather data. Switch to WEATHER and monthly temperature and rain carry the city's colours through the year. Drag to turn it; touch a particle to see that district's numbers.
EXPERIENCE THE CITY HAS A PULSE ↗DATA → FORM
- 人口(町丁・字ごと)Population
- → 粒の数
- 標高Elevation
- → 粒の高さ
- 1世帯あたりの人数Household size
- → 粒の色
- 月ごとの気温と降水量Temperature & rain
- → 色と光の移ろい(WEATHER)
- 鼓動The pulse
- → 海から山へ伝わる
データ: 令和2年国勢調査 小地域(総務省統計局)、国土地理院 標高タイル、西宮市の測定局の気温・降水量。 WebGL(three.js)でブラウザに描画。
THE WEBSITE
NEXT PROJECT
Forest Walk